Today we began to survey the diversity of living and non-living things in the field areas of our schoolyard. This project fulfills expectations for the Grade 4 science strand "habitats and communities" and also teaches and consolidates some important mathematical concepts for both grades. These concepts include estimation, fractions, percent, calculating mean and graphing change over time.
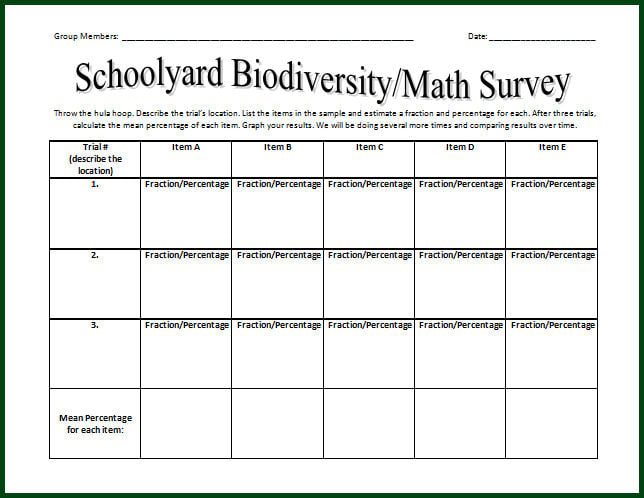
On each of five field observation days, spread ten days apart, students go outside in small groups. They throw a hula hoop, to identify a random sample area, and make a list of the the non-living items (such as sand, pebbles and sticks) and flora (such as grass and small plants) that they find inside their hoop. Then they estimate how much of each item is present in their sample area, as a fraction and a percentage.
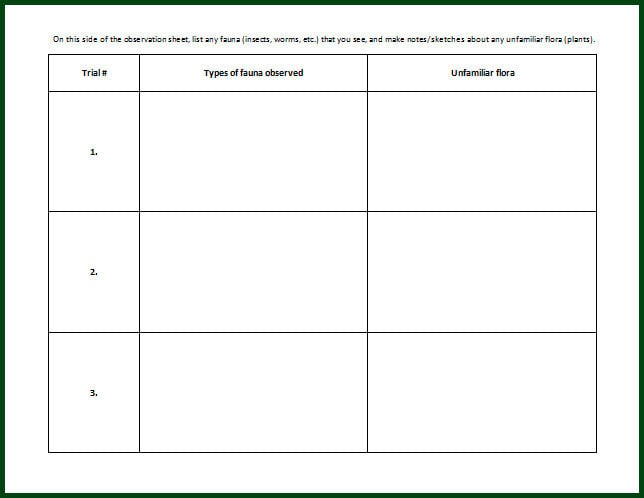
On a second observation sheet, students make notes or sketches of the fauna (insects, worms, etc.) and unfamiliar flora they notice inside the hoop, so they can look the items up in field guides once they are back in the classroom.
Afterwards, they repeat the process two more times. After all three of their field observations are complete, groups go inside and calculate the mean percentage for each item observed that day (brown grass, green grass, sand, etc.) and enter these percentages on a line graph.
By the time this project is complete, students will be able to track changes in vegetation that occur over six weeks, during the spring growing season.
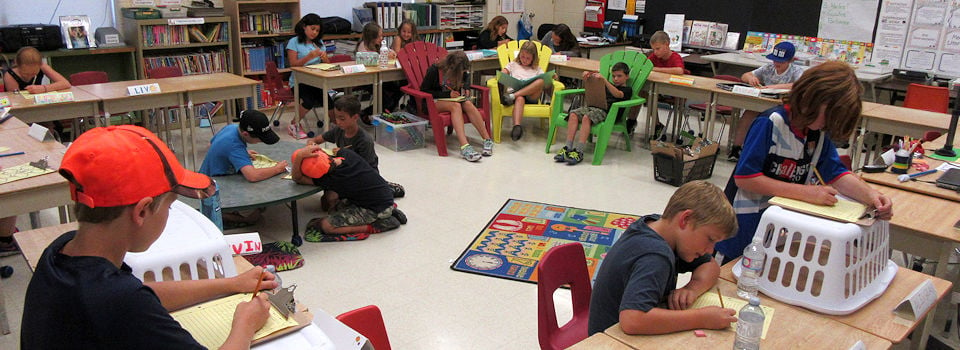
Here are some pictures of today's field work and graphing sessions:


Thank you for visiting our class BLOG. If you have any questions or comments, feel free e-mail me (Margaret Black): mblack@scdsb.on.ca or to add a comment to this page.